This information is pretty self explanatory. We’re heading headlong into very serious consequences and the conventional wisdom that things MAY change slowly is simply not adequate. We need to quit emitting CO2 by mid century and be well along the way by 2030 if we are going to be able to cope with the adaptation necessary in any orderly, reasonable and economically acceptable manner.
(The passages in red below are not mine but are part of the original publication.)
CO2, Earth’s Global Thermostat, Dials Up to Record 401.6 ppm Daily Value on March 12
NASA GISS, likely the world’s premier Earth atmospheric monitoring agency has dubbed CO2 “The Thermostat that Control’s Earth’s Temperature.” So when human fossil fuel emissions keep cranking that thermostat ever higher, it’s important sit up and take note. For, inexorably, we keep forcing atmospheric values of this critical heat-trapping gas up and up.
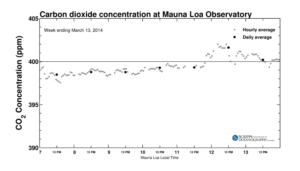
According to reports from The Mauna Loa Observatory and The Keeling Curve, daily CO2 values for March 12 rocketed to a record 401.6 parts per million. Hourly values rose briefly higher, touching 402 parts per million. Levels fell back to around 400 ppm on March 13. But the overall trend will continue upward through March, April and much of May when the height of annual atmospheric CO2 readings is typically reached.
By comparison, during May of last year, daily and weekly values hit just slightly higher than 400 parts per million while measures for the month hovered just below this number. We are now about two months away from the 2014 peak. So it appears possible that daily values could rise to 404 ppm or greater with highs for the month potentially exceeding 402 ppm (you can view a comparison graph for May 2013 here).
(Daily and hourly atmospheric CO2 values from March 7 to 13. Image source: The Keeling Curve.)
Such high levels of this gas have not been seen on Earth in over 3 million years. A time when temperatures were 2-3 degrees Celsius warmer and sea levels were 15-75 feet higher than today. And should CO2 levels merely remain at the level currently achieved, we can probably expect at least the same amount of warming long-term.
CO2 in Context
Annually, the average rate of CO2 increase now is an extraordinary 2.2 parts per million each year. This rate is about 6-7 times faster than at any time in geological history. None of the vast flood basalts of the ancient past, no period of natural vulcanism, can now rival the constant and massive injection of this powerful and long-lasting greenhouse gas by humans into the atmosphere.
Last year, the rate of increase spiked to around 2.5 parts per million and we can view this as mere prelude under a continuation of business as usual. For if human fossil fuel emissions are not radically brought into check, the ongoing economic inertia of existing fossil fuel based infrastructure and planned new projects will likely shove this rate of increase to 3, 4 even 7 parts per million each year by the end of this century. As a result, CO2 levels alone have the potential to reach catastrophic values of 550 parts per million by around 2050-2060 that, long term and without any of the added effects of other greenhouse gasses, would be enough to eventually melt all the ice on Earth and raise global temperatures to around 5-6 degrees Celsius above current levels. A level that, through acidification alone and not including damage through stratification and anoxia, could drive up to 1/3 of ocean species to extinction.
CO2 accounts for much of the greenhouse forcing when taking into account the feedbacks it produces on water vapor and clouds. NASA notes:
Because carbon dioxide accounts for 80% of the non-condensing GHG forcing in the current climate atmosphere, atmospheric carbon dioxide therefore qualifies as the principal control knob that governs the temperature of Earth.
All other greenhouse gasses pale in comparison to both its total effect and its current rate of increase. Methane, the next most potent greenhouse gas, accounts for about 15% of the forcing and is rising at a rate of 4 parts per billion (1/550 that of CO2), generating a net effect equal to, in the worst case, an additional .4 parts per million CO2 each year (.29 when aerosols drop out). A troubling and dangerous increase itself. But still a mere shadow compared to the overall rate of CO2 increase.
Only in the most catastrophic of scenarios, when added atmospheric heat, primarily generated through added CO2 and other greenhouse gas forcing, triggers methane emissions equal to 2 gigatons each year in the Arctic (a rate 25 times the current release), would the total methane forcing approach the predicted value for CO2 by the end of this century under current fossil fuel emissions scenarios. More likely, paleoclimate scenarios tend to suggest that the natural methane feedback, long-term, is roughly equal to 50% of the CO2 forcing and is largely governed by it. A dangerous amplifying feedback driven by a devastating and long-lasting CO2 forcing.
CO2 is also the longest lived of the major greenhouse gasses with one molecule of CO2 providing effective atmospheric warming for at least 500 years. By comparison, the oxidation time for a single molecule of methane is around 8 years. What this means is that it takes an ever increasing methane emission just to keep values constant while atmospheric CO2 takes much longer to level off given even a constant rate of emission.
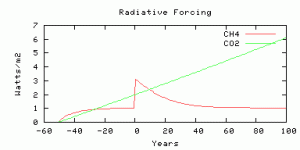
The result is that heat forcing from CO2 tends to remain constant over long periods while methane heat forcing values have a tendency to spike due to rapid oxidation.
(Radiative forcing from a 10 gigaton release of methane in red compared to expected end century CO2 values of 750 ppm. Note how the methane heat forcing spikes and then rapidly falls off. Image source: RealClimate.)
Current rates of CO2 increase, therefore, should be viewed as catastrophic to climates that are both livable and benevolent to humans. A rate of increase that puts at risk severe changes to Earth environments and which provides a trigger for setting off a series of powerful amplifying feedbacks through the medium and long term. These include both loss of ice albedo and the potential for spiking methane emissions from the widespread natural store.
UPDATE:
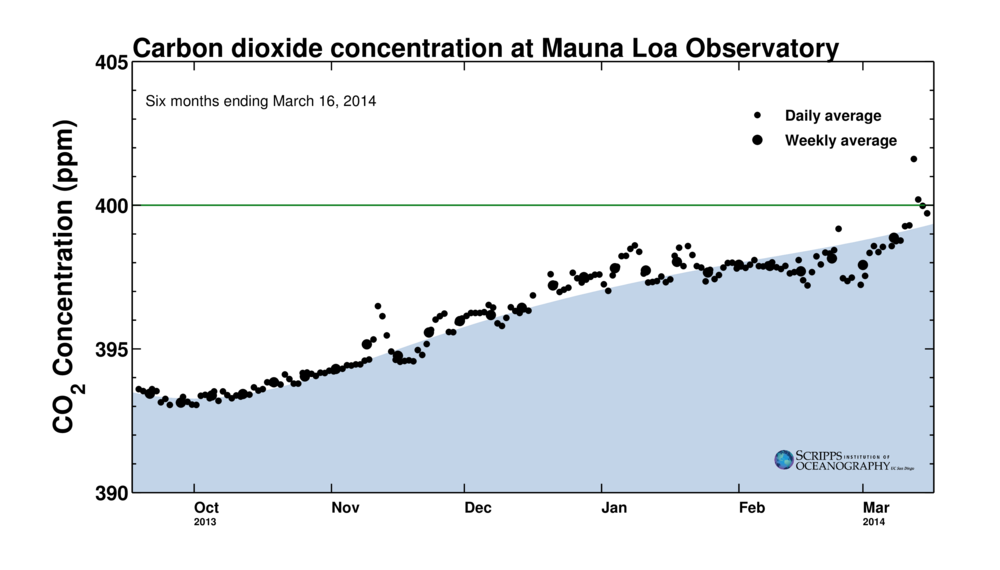
Most recent daily values from March 12 onward in relationship to the six month trend. Note the sharp spike upward at the end of the period as well as the overall volatility of the trend line. High volatility may well be an indication that the typical carbon cycle is suffering disruption with sinks, stores and sources experiencing larger than typical fluxes.
(Mauna Loa Observatory six month trend. Image source: The Keeling Curve.)
Dr. Ralph Keeling today noted:
“We’re already seeing values over 400. Probably we’ll see values dwelling over 400 in April and May. It’s just a matter of time before it stays over 400 forever.”
Links:
Tags: CO2, daily value, earths temperature, earths thermostat, global, ppm


